
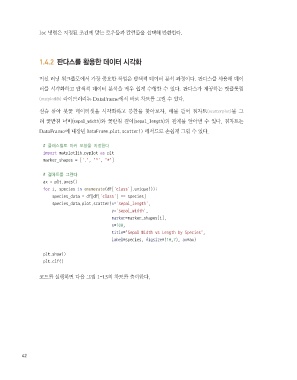
Page 30 -
P. 30
loc 명령은 지정된 조건에 맞는 로우들과 칼럼들을 선택해 반환한다.


               1.4.2 판다스를 활용한 데이터 시각화


               머신 러닝 워크플로에서 가장 중요한 작업은 탐색적 데이터 분석 과정이다. 판다스를 사용해 데이
               터를 시각화하고 탐색적 데이터 분석을 매우 쉽게 수행할 수 있다. 판다스가 제공하는 맷플롯립

               (matplotlib) 라이브러리는 DataFrame에서 바로 차트를 그릴 수 있다.
               실습 삼아 붓꽃 데이터셋을 시각화하고 통찰을 찾아보자. 예를 들어 점차트(scatterplot)를 그

               려 꽃받침 너비(sepal_width)와 꽃받침 길이(sepal_length)의 관계를 알아낼 수 있다. 점차트는
               DataFrame에 내장된 DataFrame.plot.scatter() 메서드로 손쉽게 그릴 수 있다.

                 # 클래스별로 마커 모양을 지정한다
                 import matplotlib.pyplot as plt
                 marker_shapes = ['.', '^', '*']


                 # 점차트를 그린다
                 ax = plt.axes()
                 for i, species in enumerate(df['class'].unique()):
                     species_data = df[df['class'] == species]
                     species_data.plot.scatter(x='sepal_length',
                                               y='sepal_width',
                                               marker=marker_shapes[i],
                                               s=100,
                                               title="Sepal Width vs Length by Species",
                                               label=species, figsize=(10,7), ax=ax)

                 plt.show()
                 plt.clf()


               코드를 실행하면 다음 그림 1-13의 차트를 출력한다.


         42


     신경망교과서_07.indd   42                                                                     2020-05-19   오전 9:04:32